

Changes in LE since 2019
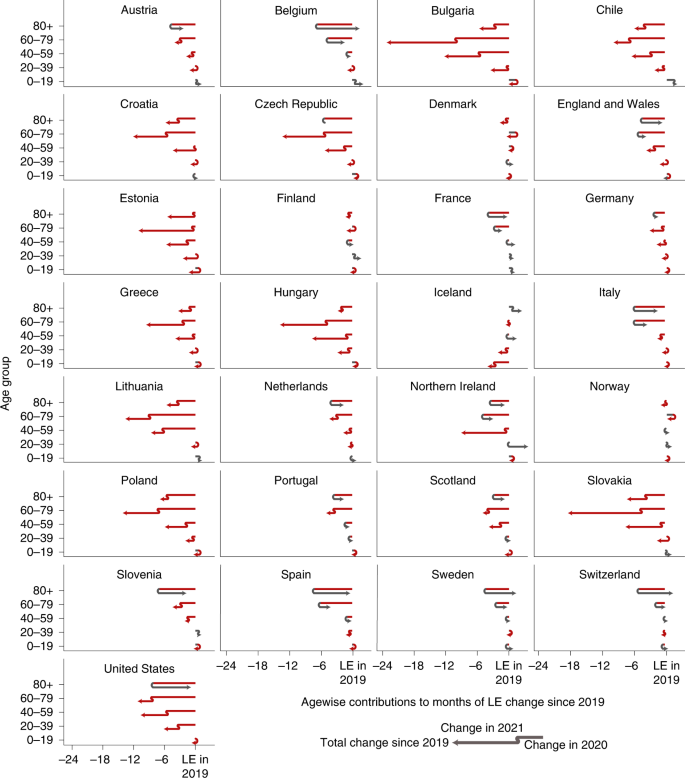
Among the 29 countries analysed, 8 countries saw significant LE bounce backs from 2020 losses: Belgium (+10.8 months; 95% confidence interval (CI), 9.7 to 11.9; H0: μ ≤ 0; P < 0.001), Switzerland (+7.7; 95% CI, 6.4 to 8.8; P < 0.001), Spain (+7.6; 95% CI, 7.1 to 8.1; P < 0.001), France (+5.0; 95% CI, 4.4 to 5.6; P < 0.001), England and Wales (+2.1; 95% CI, 1.6 to 2.7; P < 0.001), Italy (+5.1; 95% CI, 4.6 to 5.5; P < 0.001), Sweden (+7.5; 95% CI, 6.0 to 8.6; P < 0.001) and Slovenia (+3.1; 95% CI, 0.4 to 5.7; P = 0.010). Compounding the 2020 losses, LE dropped significantly further throughout 2021 in 12 countries: Bulgaria (−25.1 months; 95% CI, −23.4 to −26.6; H0: μ ≥ 0; P < 0.001), Chile (−8.0; 95% CI, −7.0 to −9.0; P < 0.001), the Czech Republic (−10.4; 95% CI, −9.4 to −11.5; P < 0.001), Germany (−3.1; 95% CI, −2.7 to −3.5; P < 0.001), Estonia (−21.5; 95% CI, −17.6 to −25.1; P < 0.001), Greece (−12.4; 95% CI, −11.0 to −13.8; P < 0.001), Croatia (−11.6; 95% CI, −9.7 to −13.3; P < 0.001), Hungary (−16.4; 95% CI, −15.3 to −17.6; P < 0.001), Lithuania (−7.9; 95% CI, −5.4 to −10.5; P < 0.001), Poland (−12.1; 95% CI, −11.3 to −12.7; P < 0.001), Slovakia (−23.9; 95% CI, −22.3 to −25.7; P < 0.001) and the United States (−2.7; 95% CI, −2.2 to −3.1; P < 0.001). LE in Scotland and Northern Ireland remained at approximately the same depressed levels as in 2020, indicating a constant excess mortality. In terms of LE changes since 2019, the extremes are marked by Bulgaria, with record compound LE losses across 2020 and 2021, and France, Belgium, Switzerland and Sweden, all with complete LE bounce backs from substantial prior losses. Of the three countries that experienced no LE loss in 2020 (Denmark, Norway and Finland), only Norway had a significantly higher LE in 2021 than in 2019 (Fig. 1 and Table 1).
The countries are ordered by increasing cumulative LE losses since 2019. The two line segments indicate the annual changes in LE in 2020 and 2021. Red segments to the left indicate an LE drop, while grey arrows to the right indicate a rise in LE. The position of the arrowhead indicates the total change in LE from 2019 through 2021. The grey dots and lines indicate the average annual LE changes over the years 2015 through 2019 along with 95% CIs. Δe0 marks the change in period LE over the designated period.
In all countries, LE in 2021 was lower than expected under the continuation of pre-pandemic trends. Bulgaria, Chile, Croatia, the Czech Republic, Estonia, Germany, Greece, Hungary, Lithuania, Poland and Slovakia suffered substantially higher LE deficits in 2021 than in 2020, indicating a worsening mortality burden over the course of the pandemic (Extended Data Figs. 1–3).
Bulgaria experienced 17.8 months of LE decline in 2020 (95% CI, −16.5 to −19.8; H0: μ ≥ 0; P < 0.001). This substantial decline was compounded by an even larger loss of 25.1 months (95% CI, −23.4 to −26.6; P < 0.001) below the 2020 level in 2021, leaving the country with a net LE loss of 43.0 months (95% CI, −41.4 to −44.5; P < 0.001) since 2019. Bulgaria is the most severe example regarding LE losses among the nine countries from the former Eastern Bloc (Bulgaria, Slovakia, Lithuania, Poland, Estonia, Hungary, the Czech Republic, Croatia and Slovenia). Except Slovenia, all these countries suffered compound LE losses in 2021. Estonia stands out as the country with the third-largest LE losses in 2021 but almost no losses in 2020. Substantial compound losses were also observed in Chile and Greece. In contrast, after an 8-month LE loss in 2020, Switzerland experienced a bounce back of 7.7 months (95% CI, 6.4 to 8.8; H0: μ ≤ 0; P < 0.001). Belgium, Sweden, France, Italy and Spain joined Switzerland as countries that witnessed bounce backs from substantial LE losses in 2020, with the first three countries having regained the LE levels of 2019 (Fig. 1 and Table 1).
Age contributions to LE changes
In 2021, the pandemic death toll shifted towards younger age groups. For example, while US mortality for ages 80+ returned to pre-pandemic levels in 2021, overall LE losses grew due to worsening mortality in ages below 60. Mortality increases among ages below 60 contributed LE losses of −7.2 months (95% CI, −7.0 to −7.4; H0: μ ≥ 0; P < 0.001) in 2021 compared with 2020. These LE losses among the young cancel the LE bounce backs among the older population and yield a net LE drop in 2021 of −2.7 months (95% CI, −2.2 to −3.1; H0: μ ≥ 0; P < 0.001) for the United States (Fig. 2). Excess mortality among under-60s explained more than half of the loss in US LE since the start of the pandemic (58.9%; 95% CI, 57.9 to 59.8; H0: μ ≤ 50%; P < 0.001). LE losses in the under-60s, especially for males, were considerably higher in the United States than in most other countries in 2020 as well6.
The position of the arrowhead indicates the contribution of mortality changes in a given age group to the change in LE at birth since 2019. The discontinuity in the arrow indicates those contributions separately for the years 2020 and 2021. Annual contributions can compound or reverse. Red indicates negative contributions, and grey indicates positive contributions. The total LE change from 2019 to 2021 in a given country is the sum of the arrowhead positions across ages.
The pattern of the shift in excess mortality away from the oldest ages in 2021 compared with 2020 is also evident in Austria, Belgium, the Czech Republic, England and Wales, Germany, the Netherlands, Northern Ireland, Poland, Portugal, Scotland, Slovakia, Slovenia and Spain (Fig. 2). In 11 of the 16 countries with LE losses in 2021, the under-60 age groups contributed significantly more to LE loss in 2021 than in 2020 (one-tailed, P < 0.05). Among the 13 countries that partially or completely bounced back from their LE losses in 2020, 10 (Austria, Belgium, Switzerland, Spain, France, England and Wales, Italy, Netherlands, Sweden and Slovenia) achieved the bounce back primarily or solely due to normalizing mortality among the older population (H0: μ ≤ 50% contribution of ages 60+ to LE change; P < 0.05; Table 1). Croatia, Greece, Hungary, Northern Ireland and Slovakia saw almost no losses in the 40–59 age group in 2020 but substantial excess mortality in the same group in 2021 (Fig. 2).
Despite the shift towards a greater contribution of excess mortality from younger age groups in 2021, increased mortality among those aged 60+ remained the most important contributor to LE losses compared with pre-pandemic levels (Table 1). LE dropped in 28 of the 29 countries analysed from 2019 to 2021, with only Norway exceeding the 2019 levels. Excess mortality in ages 60+ was the main or sole contributor to these losses in 19 of 28 countries (Austria, Bulgaria, Chile, the Czech Republic, Germany, Estonia, Spain, France, England and Wales, Greece, Croatia, Hungary, Italy, Lithuania, the Netherlands, Poland, Portugal, Slovenia and Slovakia, H0: μ ≤ 50% contribution of ages 60+ to LE change; P < 0.05), with the United States being the prominent exception. In 2020, the LE losses of every country witnessing significant losses were explained primarily or solely by mortality increases in ages 60+. The LE changes in 2021 were, however, sometimes driven by mortality dynamics below age 60. France stands out as the only country that suffered significant LE losses since 2019 without increased mortality among those under 60 (Table 1 and Fig. 2).
Sex differences in LE changes
Recent trends of a decreasing gap in LE between females and males20 were disrupted by the pandemic. Consistent with previous research, females showed higher LE in the 29 countries in our analysis. The magnitude of the gap in 2021 varied from 3.17 years in Norway (95% CI, 2.95 to 3.37; H0: μ ≤ 0; P < 0.001) to more than 9.65 years in Lithuania (95% CI, 9.20 to 9.90; P < 0.001). However, our results show that the female advantage in LE significantly (H0: μ ≤ 0; P < 0.05) increased in 16 of the 29 countries during the pandemic, thereby widening the sex gap (Fig. 3). This finding indicates that in most countries, males were more affected by excess deaths. The biggest increase in the sex gap was observed in the United States, where the gap increased by almost a year from 5.72 to 6.69 years (+0.97 years; 95% CI, 0.90 to 1.04; H0: μ ≤ 0; P < 0.001). The narrowing sex gaps observed in six countries were not significant. See Extended Data Figs. 4–7 and Supplementary Tables 1 and 2 for further sex-specific results on LE levels and changes.
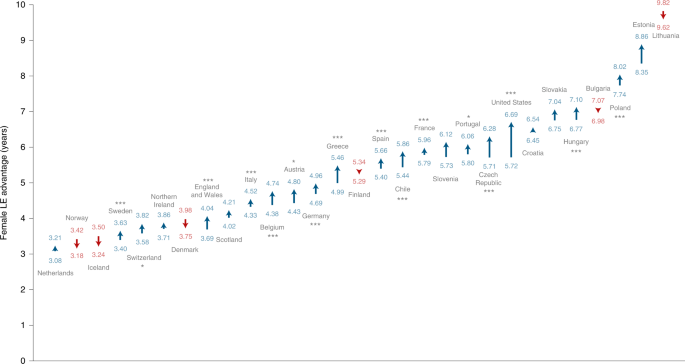
The blue upwards arrows indicate increases and the red downwards arrows indicate decreases in the female LE advantage. We tested the hypothesis of no change in the sex gap between 2019 and 2021. *P ≤ 0.05; ***P ≤ 0.001.
LE deficit contributions by cause of death and age
Officially registered COVID-19 deaths explained most of the LE deficit in the year 2021 across Europe, the United States and Chile (Fig. 4). The Netherlands is the single exception where causes other than COVID-19 explained more than half (51.7%) of the 2021 LE deficit. Conversely, France, Slovenia, and England and Wales stand out as three countries where mortality due to non-COVID deaths was lower than expected in 2021. In the majority of countries, the age group 60–79 contributed the most to the LE deficit in 2021. The exceptions were Scotland and Germany, the former having the largest contributions among ages 40–59 (0.45 of the 0.86 years of total LE deficit), the latter among ages 80+ (0.43 of the 0.86 years of total LE deficit). Note that COVID-19-related deaths are counted differently across countries and that some cross-country differences are explained by different reporting conventions as outlined in the Discussion. As CIs do not account for these biases, we chose to not report them for this section.
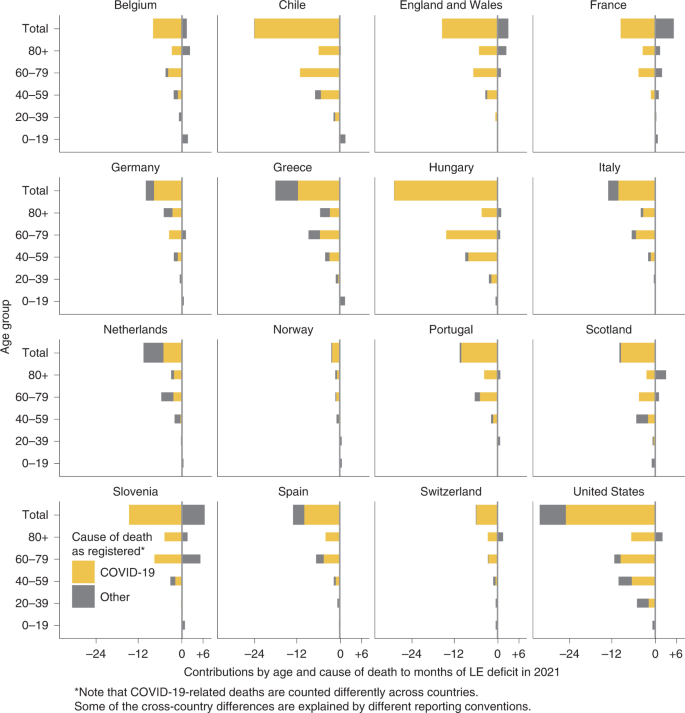
LE deficit is defined as observed minus expected LE had pre-pandemic mortality trends continued.
LE deficit by vaccination uptake
Higher vaccination uptake by October 2021 was associated with smaller LE deficits in quarter 4 of 2021 across countries among ages 60+ and <60 (r60+ = −0.86; two-tailed P < 0.001; 95% CI, −0.94 to −0.69; r<60 = −0.74; two-tailed P < 0.001; 95% CI, −0.88 to −0.46; Fig. 5). Eastern Europe, especially Bulgaria, had lower vaccination uptake and showed bigger deficits in LE, while the opposite was true for most central and western European countries.
<div class="c-article-section__figure js-c-reading-companion-figures-item" data-test="figure" data-container-section="figure" id="figure-5" data-title="Years of LE deficit in October through December 2021 contributed by ages
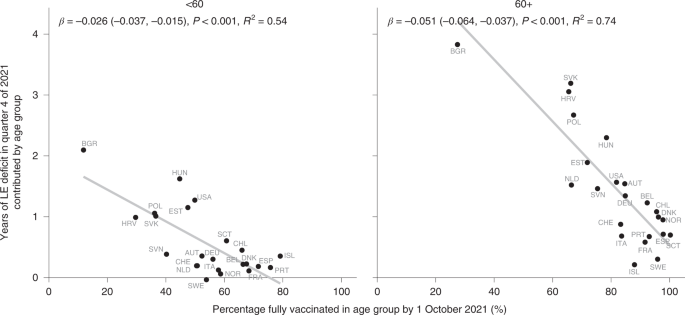
LE deficit is defined as the counterfactual LE from a Lee–Carter mortality forecast based on death rates for the fourth quarter of the years 2015 to 2019 minus observed LE. The points are labelled with ISO three-letter country codes.
The direction of this association was the same when comparing the contributions of the age groups <60 and 60+ to the LE deficit in 2021, albeit with variation in the strength of the association. Vaccination uptake for people 60+ showed a stronger association with LE deficits.
Prominent outliers indicate a confounded relationship between vaccination uptake and LE losses. For those under age 60, the United States saw a far higher LE deficit than countries with comparable overall vaccination shares, such as the Netherlands, Austria and Switzerland. For ages 60+, Slovakia, Croatia and Hungary stand out as countries with surprisingly high LE deficits given their vaccination uptake. Finer-grained details of the age prioritization of vaccine roll-out and the types of vaccines used may account for some of these differences, as well as correlations between vaccine uptake and compliance with non-pharmaceutical interventions or the overall health care system capacity.
Comparison with past mortality shocks
To contextualize the severity of the LE losses during the COVID-19 pandemic, we examined historical mortality crises over the past 120 years and qualitatively compared them with LE declines since 2019. As shown in Fig. 6, the first half of the twentieth century witnessed several mortality shocks leading to LE declines across consecutive years, but in most cases these were followed by immediate bounce backs. In the past 40 years, the frequency of mortality crises fell markedly. Supplementary Table 3 shows the total negative or overall change in LE during the period of a mortality crisis and the year at which recovery to pre-crisis LE was reached.
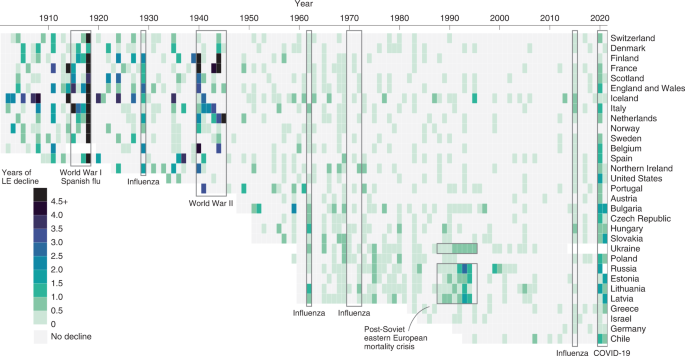
Period shocks to LE due to wars and epidemics show up as green vertical bands across countries, momentarily disrupting the dominant trend of expectancy improvements, shown in grey.
During World War I and the Spanish flu epidemic, all countries for which historical data are available experienced substantial losses in LE—the largest annual declines in LE in the past 120 years. In most countries, LE declined continuously throughout the four-year period of the crises, but the losses were the largest in 1918. The steepest declines in LE during 1914–1918 were seen in Italy (−22.7 years) and France (−16.5 years). Denmark, similarly to patterns during COVID-19, experienced the lowest decline in LE during Spanish flu—only one year. Notably, even after all these substantial losses in LE, the recovery to pre-crisis levels was achieved in one or two years (Supplementary Table 3).
Mortality patterns during World War II were somewhat different. While most countries suffered some years with substantial LE declines during 1939–1945, the bounce backs occurred during the war or just after it. In the Netherlands, the famine known as Hunger Winter caused LE declines in 1945 of 5.7 years, but LE had already recovered to pre-war (1938) levels by 194621.
Numerous flu epidemics occurred over the second half of the twentieth century, but LE during these flu seasons usually declined only very slightly, if at all. Moreover, bounce backs were always immediate, except in cases of wider health crises, such as the recovery from the 2015 influenza season in Scotland and United States, where LE was already stagnating before the epidemic5. Overall, the losses during these flu epidemics were substantially smaller than the declines in LE during the COVID-19 pandemic.
The most prominent example of a protracted mortality crisis in the past 50 years is provided by Russia and Eastern Bloc countries. From 1960s onwards, these countries experienced an extended period of continuous stagnation in LE, in which bounce backs to pre-decline levels were attained only in the twenty-first century22. These patterns reflect the deep-rooted structural nature of the mortality crisis in the populations that failed to proceed with the health transition23. The most pronounced drop in LE happened in these countries in late 1980s and early 1990s (Fig. 6), which mirrored the previous brief period of success in lowering mortality24 as a direct result of Gorbachev’s anti-alcohol campaign25. In contrast to epidemic or war-related shocks, the mortality crisis in the formerly Eastern Bloc countries was structural, and the bounce backs of LE were very slow. The magnitude of LE losses witnessed during COVID-19 in the formerly Eastern Bloc countries are comparable to those observed during the Soviet mortality crisis.


