
Empirical evidence on the efficiency of backward contact tracing in COVID-19

Study cases and contacts
Our test and trace programme ran from September 2020 until May 2022. Due to gradual improvements in organisation and data collection, there was a marked increase in the ratio of contacts with outcome data after the initial months of the programme (Supplementary Fig. 3). The study period for the main analyses was chosen from 1st February 2021 to 31st May 2021, which was after the initial set-up phase of the programme and included both an upward and a downward trend in country-wide infection rates.
In total, 14,917 students underwent RT-qPCR testing at our centre in this period (3.8 tests per 1000 persons daily), resulting in 498 students with a new diagnosis of COVID-19. A further 231 positive RT-qPCR test results of students in the study population were reported to us from external sources, resulting in a total of 729 cases. Thirty-six (4.9%) of these were interpreted as a past infection or false positive by the treating physician, leaving 693 actual cases (14-day incidence of 245 per 100,000). Six cases (0.9%) were considered lost to follow-up, because they could never be contacted by the contact tracing team, and 28 (4.1%) were excluded because data on presence of symptoms was missing. Therefore, 659 index cases remained in the analysis (Fig. 3).
The number of included and excluded cases and contacts is shown for the main alpha-dominant cohort.
In total, 72.5% of index cases self-reported being symptomatic at the time of testing, which was similar to the national average37. Index cases had a mean age of 21.4 years (SD: 3.60 years, missing data 15.0%) and were 51.1% male (missing data 12.1%).
Contact tracing of the index cases resulted in 3971 case-contact pairs (mean 6.0 contacts per case, 2.2 times the national average37), of which 956 (24.1%) were excluded because the contact person already had a positive test result 0 to 60 days before the positive test of the index case. Another 331 (11.0%) contacts were excluded because they already had a known exposure to a different infected individual within 7 days before the tracing interview. Finally, 288 contacts (10.7%) were lost to follow-up. The distribution of the number of contacts per index case in shown in Supplementary Fig. 4.
The resulting 2396 contacts were divided into two groups. The standard tracing window group, which would have been identified through standard practice, consisted of 1608 individuals in close contact with the index case in the period from 2 days before onset or test until the contact tracing interview. The backward traced group consisted of 788 additional contacts in the extended tracing window, i.e. their last close interaction with the index case was 3 to 7 days before onset or test. For the main analysis, we did not make assumptions on the directionality of transmission. Therefore, both the forward and backward traced group likely included parent, sibling and child cases.
We did not collect demographic data on contacts of index cases.
The control group consisted of all 1461 students who attended our test centre for the first time with self-reported symptoms suggestive of COVID-19 as the main reason for their test.
There was a slightly higher percentage of women in the control group (56.5%, missing data 3.0%) compared to the index cases, while the mean age was similar (22.0 years; SD 3.84 years, missing data 3.0%). The temporal distribution of individuals in the backward traced contact and symptomatic control groups is shown in Supplementary Fig. 1a.
High risk of infection in the extended tracing window
By extending the contact tracing window, 49% more contacts at risk and 42% more cases were identified as direct contacts of an index case, compared to standard contact tracing practice alone.
The risk of infection in the standard and extended tracing window groups was similar, namely 17.2% in the former (CI 15.4–19.1%) and 14.6% in the latter (CI 12.2–17.3%). The risk in the extended tracing window group was significantly higher (risk ratio 2.22, CI 1.72–2.88, p < 0.0001) than the risk of 6.5% (CI 5.3–7.9%) in the control group, demonstrating the relative efficiency of extending the contact tracing window to 7 days prior to symptom onset or test (Fig. 4).
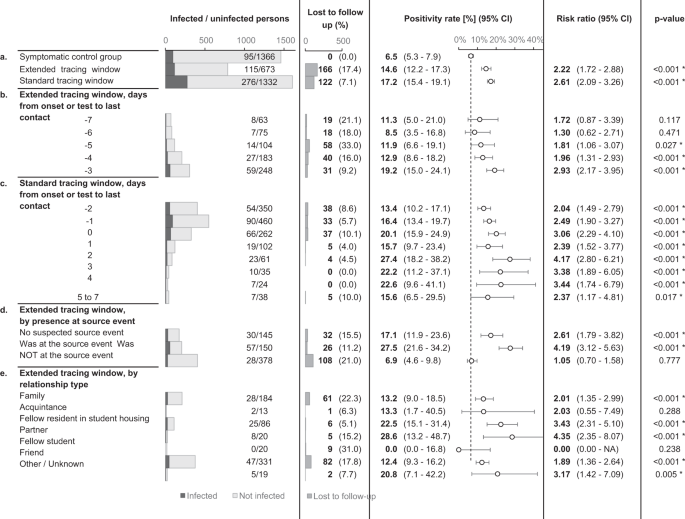
The dotted line indicates the positivity rate in the control group. The error bars indicate 95% two-sided confidence intervals (Clopper–Pearson). * indicates a statistically significant difference in comparison to the control group (p < 0.05) as assessed using a two-sided Chi-squared test, not adjusted for multiple comparisons. Section a tests the main hypothesis by comparing the extended tracing window to the symptomatic control group. Subgroups by the numbers of days from onset or test of the index case to the last interaction with the index case are shown in section b, c for the extended and standard tracing windows respectively. Section d shows subgroups according to presence at suspected source events, and subgroups by relationship type are shown in e.
Contacts in the standard and extended tracing window groups were subgrouped by their last day of contact with the index case, relative to symptom onset or test. The results show that the number of additional identified close contacts per day decreased markedly as the tracing window was extended backward. The risk of infection varied from 8.5 to 19.2%, and the confidence interval lower bound did not drop below 3.5% for any of these subgroups in the extended tracing window. For day 3, 4 and 5 before onset or test, the risk was significantly higher than the control group (p < 0.05).
The risk is not limited to suspected source events
An important consideration when deciding between a source investigation approach and an extended tracing window is the risk of infection for contacts not present at suspected source events. A suspected source event was identified for 80.6% of index cases. If the contact tracing interview failed to suggest a source event, the risk of infection for extended tracing window contacts was 17.1% (CI 11.9–23.6%). If a source event was identified, the risk was around four times higher for contacts who attended the event (absolute risk 27.5%, CI 21.6–34.2%) compared to those who did not. The latter group still had a risk of 6.9% (CI 4.6–9.8%), which was similar to the symptomatic control group but not significantly higher (Fig. 4a).
Risk by relationship type
In an explorative subgroup analysis, extended tracing window contacts were grouped according to relationship type with the index case. The majority of identified contacts were either family (28.6%), fellow residents in student housing (12.3%), or friends (48.2%). Each of these three groups had a significantly increased infection risk as compared to the symptomatic control group. The other subgroups lacked sufficient numbers for statistical power (Fig. 4e).
Backward contact tracing identifies cases later in their infection
Effective contact tracing requires the detection of infected contacts as soon as possible, before they reach the end of their contagious period. The sibling and especially parent cases targeted by backward contact tracing can be expected to be in a later stage of infection compared to forward traced contacts, potentially leading to lower efficiency of tracing, testing and quarantine measures.
Indeed, when comparing the date of detection of an index case with the onset date of their infected contact, the infected contacts in the extended tracing window were on average 1.8 days later in their infectious cycle compared to those in the standard tracing window (Fig. 5a). The difference could be interpreted as a reduction in contact tracing efficiency equal to an additional testing or tracing delay of the same period.
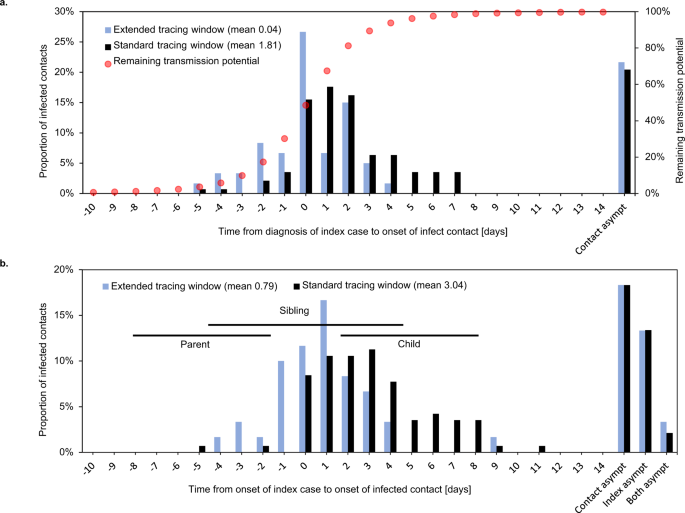
Symptom onset in infected contacts relative to sampling (a) or symptom onset (b) of the index case. Asympt asymptomatic. Case–contact pairs that were excluded from the mean calculation because either or both were asymptomatic, are shown on the right. Panel a shows the delay between detection of an index case and symptom onset of their infected contact. Red dots show the estimated remaining fraction of transmission potential of the infected contact at the time of sampling of the index case. Forward traced symptomatic contacts were detected on average 1.8 days earlier in their infectious cycle than their backward traced counterparts, assuming equal delays between index case diagnosis and tracing of the contact. This resulted in a 28% lower mean remaining transmission potential for backward traced contacts at the time of index case testing. Panel b shows the delay between symptom onset of an index case and their infected contact. Horizontal lines indicate the 25th–75th percentile ranges of expected timings for parent, sibling and child cases, based on a published normal distribution of the serial interval38. The observed timings are compatible with a high proportion of sibling cases and few parent or child cases in the backward traced group.
The difference of 1.8 days in contact symptom onset relative to index case detection is much smaller than we would expect if all backward and forward traced contacts were parent and child cases, respectively (double the mean serial interval of around 5 days)38. One possible explanation is than sibling cases make up a considerable share of contacts in both groups. Although we cannot ascertain the relative positions of infected contacts in the transmission tree, the observed timings would be consistent with a higher fraction of sibling cases in the backward traced group and a minority of parent cases in both groups (Fig. 5b).
To quantify the fraction of transmissions averted through quarantine of symptomatic infected contacts, we used a distribution of timing of transmission relative to symptom onset (Fig. 5a)39. At the time of testing of the index case, the mean fraction of remaining transmission potential was 28% lower for infected backward as opposed to forward traced contacts.
Less tests and shorter quarantine in the backward traced group
The value of contact testing depends not only on test specific diagnostic performance, but also on timing. Immediate testing after contact identification can accelerate iterative tracing (“test to trace”). It can also reduce the total duration spent in quarantine and isolation, in settings where release from isolation is dependent on the timing of diagnosis. Tests after a latent period are more sensitive and can thus be used to allow shortening of quarantine for non-infected contacts (“test to release”) (Fig. 6c)40.
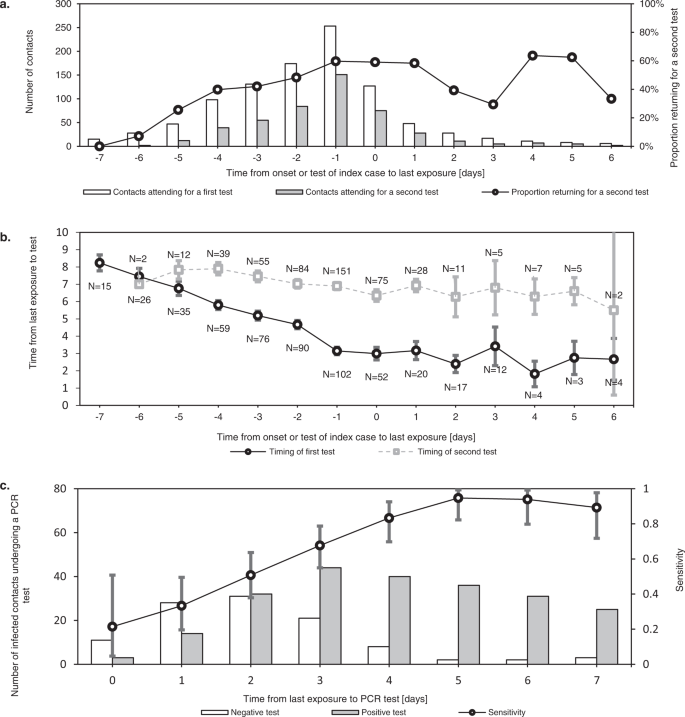
Error bars indicate 95% confidence intervals. a shows the number of contacts who underwent a first and second tests at our test centre after their exposure. This demonstrates how testing immediately after exposure (“test to trace”) was most often complemented with testing after a latent period (“test to release”). While the former mainly supports iterative tracing and in some cases a shortened isolation period, the latter allows shortening of quarantine for non-infected contacts. As the delay between last exposure and symptom onset or testing of the index case increased, the percentage of contacts requiring two tests decreased. b shows the mean timing of first and seconds tests at our centre for contacts, relative to their last exposure. The difference in timing of the first and second tests is reduced as the contact tracing window is extended further back in time. c shows the test results of infected contacts by day after last exposure, demonstrating how the sensitivity of RT-qPCR testing increased rapidly in the first days after exposure.
During the study period, contacts were requested to undergo RT-qPCR tests both as soon as possible after identification and again 7 days after last exposure, which is reflected in the timing of contact testing in our dataset (Fig. 6b).
As backward traced contacts were detected a minimum of 3 days after their last exposure by definition and an average of 4.0 days longer after last exposure than forward traced contacts in our dataset, a single test at identification was more likely to serve both a “test to trace” and “test to release” strategy concurrently. We estimate a reduction of 17% in the number of tests required per traced contact, based on a delay from index case testing to contact testing of 1 day (Supplementary Fig. 5).
Another consequence of this inherent difference in last exposure date is that, in our dataset, the mean duration of quarantine was 3.0 days (57%) shorter for contacts in the backward traced group compared to the forward traced group. This result assumes a duration of quarantine from index case diagnosis until 7 days after exposure, with a minimum of 1 day to allow for contact testing (Supplementary Fig. 5).
Impact of changing viral variants
Consecutive SARS-CoV-2 variants of concern (VOC) may have challenged the effectiveness of contact tracing in several ways. First, increased intrinsic transmissibility may have rapidly overwhelmed the public health system41,42. Second, shortened incubation periods and serial intervals possibly outpaced the delays inherent in testing and tracing34,43,44. To assess the influence of these altered transmission dynamics, the main analysis was repeated for periods when the Delta and Omicrons VOCs were dominant nationally (Fig. 7). These periods differed from the main study period not only in terms of the dominant circulating VOC, but also in the immune status of the target population, the general contact restrictions in place, the COVID-19 incidence rate and the government requirements concerning testing and quarantine (Supplementary Figs. 3, 7, 9 and 10)37,45,46.
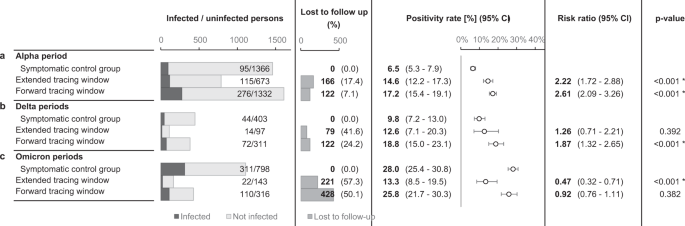
The contact took place in selected periods, differing with regards to the dominant variants of concern, immunity, level of viral circulation, social contact restrictions and government testing/quarantine strategy. The error bars indicate 95% two-sided confidence intervals (Clopper–Pearson). * indicates a statistically significant difference in comparison to the control group (p < 0.05) as assessed using a two-sided Chi-squared test, not adjusted for multiple comparisons. a repeats the main study outcomes from Fig. 4a, while the results from subsequent periods are shown in b, c.
Unfortunately, follow-up rates dropped markedly after the main study period, especially for contacts in the extended tracing window. During the periods characterised by Delta dominance, backward traced contacts had similar PR to both forward traced contacts and symptomatic controls, further supporting our main hypothesis (Fig. 7b). During the periods characterised by Omicron dominance and an almost fully vaccinated population, backward traced contacts retained a very high PR (mean 13.3%, CI 8.5–19.5%)47,48. It was however significantly lower than the much increased PR in symptomatic controls and forward traced contacts (Fig. 7c).
Iterative contact tracing in a branching process model
As mentioned, iterative contact tracing of infected contacts is thought to play a larger role in backward contact tracing. However, many of the reported contacts in our dataset were outside the study population, which means their contacts were not iteratively traced using the same backward tracing strategy if infected. To estimate how efficient backward contact tracing would be if all infected contacts were iteratively traced, we used a simple branching process model. The design of the model, described in Supplementary Methods, requires no assumptions on the direction of transmission or the probability of an infected contact being traced. This model allowed us to estimate, for our setting, the total expected number of traced contacts from a primary index case, over multiple iterations of contact tracing, based on the observed numbers of infected contacts in the main study period (Supplementary Fig. 8 and Supplementary Table 1). We then quantified several measures of costs and benefits of an extended contact tracing window relative to standard contact tracing practice alone.
The results are summarised in Fig. 8 and model details are shown in Supplementary Fig. 8. When taking into account iterative tracing of backward and forward traced contacts, an extended contact tracing window identified 55% more cases than forward tracing only (Fig. 8a). It also detected 61% more asymptomatic cases and averted 38% more infections, using the measure of remaining transmission potential described above. On the other hand, backward tracing required 78% more contacts to be traced, 67% more tests and 40% more quarantine days (Fig. 8b). Additional benefits and costs both declined for each day the contact tracing window was extended backwards. Although fewer cases were identified per traced contact, the lower number of required tests and quarantine days lead to a cost-benefit balance which remained favourable relative to forward contact tracing, depending on which cost and benefit measures were considered (Fig. 8c).
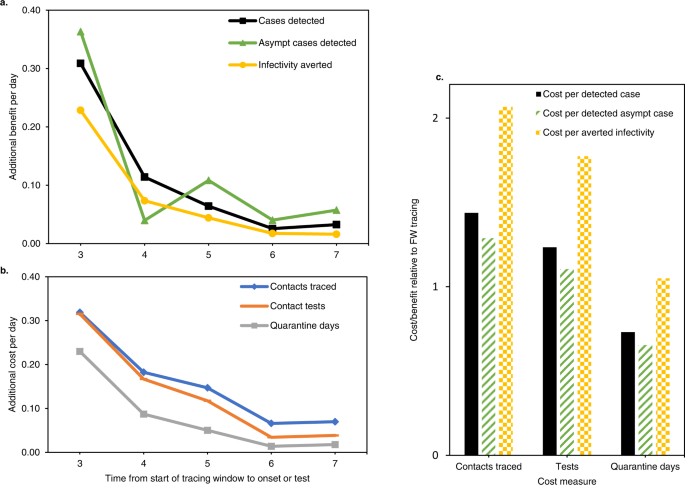
Asympt asymptomatic. a, b show the marginal benefits and costs respectively, per day that the tracing window is extended backward. Both are given as a fraction of the benefits and costs of a standard forward tracing window. c show the total cost/benefit ratio of a contact tracing window extended to 7 days before onset or test, relative to a standard forward tracing window. Combinations of three cost and three benefit measures are shown. “Averted infectivity” denotes the number of detected cases, multiplied with their remaining fraction of transmission potential according to Fig. 5a. This measure of benefit accounts for the observation that backward traced cases were detected later in their infectious cycle. In this figure, “averted infectivity” can be considered equivalent to the number of averted infections, with the important caveat that it only includes child cases of a detected case, not any subsequent averted branches of the transmission tree.


