Effectiveness of an inactivated Covid-19 vaccine with homologous and heterologous boosters against Omicron in Brazil


Study setting and design
We conducted a matched test-negative case-control study between September 6, 2021, and April 22, 2022, in Brazil. The national Covid-19 vaccination campaign started on January 17, 2021, and the administration of booster doses began for the general population on September 6, 2021. The primary series used in Brazil were homologous schemes of Sinovac CoronaVac (two doses), Oxford-AstraZeneca ChAdOx1 nCoV-19 (two doses), Pfizer BNT162b2 (two doses), Janssen Ad26.COV2.S (single dose), and heterologous combinations of the above products in periods of vaccine shortage. All four vaccine products were administered as a homologous or heterologous booster dose. There was no differential recommendation for which vaccine to be administered, except a suggestion for BNT162b2 if available. The booster vaccination followed an age-prioritization scheme. The interval between second and booster doses was initially six months and was subsequently shortened to four months during November 2021 in some states and nationally on December 20, 2021. The proportion of individuals with a primary series of CoronaVac who received a booster dose of Ad26.COV2.S or ChAdOx1 nCoV-19 was small; therefore we limited our analysis to booster doses of CoronaVac and BNT162b2.
Data sources
We obtained individual-level information on Covid-19 outcomes from two national surveillance databases in Brazil: e-SUS and SIVEP-Gripe. e-SUS collects information of any individual suspected to have mild Covid-19 syndromic illnesses, including those who were not tested, tested negative and tested positive. SIVEP-Gripe collects information on any severe acute respiratory infection, including all Covid-19 hospitalizations and deaths3,5,28. We obtained individual-level vaccination status from the national vaccination database (SI-PNI). Notification to these three systems is compulsory in Brazil. The three databases have a unique identifier after pseudo-anonymization by the Ministry of Health. Additional information is available on Supplementary Table 1. We extracted eSUS, SIVEP-Gripe and SI-PNI on 29/04/2022 and used data until 22/04/2022, allowing for a one-week potential delay. This study was approved by the ethical committee for research of Federal University of Mato Grosso do Sul (CAAE: 43289221.5.0000.0021)
The study population was adults (aged ≥18 years) residing in Brazil, and who underwent SARS-CoV-2 RT-PCR or rapid antigen testing associated with symptomatic illness29 during the study period. We excluded individuals with missing or inconsistent information on age, sex, municipality of residence, and on vaccination and testing status and dates. We excluded RT-PCR/antigen tests that were not collected within 10 days of symptom onset to avoid potentially misclassification, positive or negative RT-PCR/antigen tests with a positive RT-PCR/antigen test in the previous 90 days to capture only incident infections and avoid a second positive test because of prolonged viral shedding, and negative RT-PCR/antigen tests with a positive RT-PCR/antigen test occurring in the following 14 days because of likely false-negative test in the first negative test. For individuals who received multiple RT-PCR or antigen tests during the study period, we included all eligible tests up to and including the first positive test (ie, the first positive test in the study period and at least 90 days prior to another positive). The number of RT-PCR/antigen tests performed during the study period in Brazil is shown in Supplementary Fig. 1.
To assess waning of the booster doses over time since administration, we performed a separate, secondary, case-control analysis on the same study population, restricting to cases and controls who received a primary series of CoronaVac and received an RT-PCR/antigen test at least six months after their second dose, i.e. when eligible for a booster dose. The study design and matching procedure was otherwise the same.
Selection of cases and matched controls
Cases were defined as those from the study population who had Covid-19 symptoms, defined by the presence of at least one symptom: fever, sore throat, headache, cough, chills, runny nose, dyspnea, anosmia, and ageusia, and a positive SARS-CoV-2 RT-PCR/antigen test result. Eligible controls were defined as those from the study population who had Covid-19 symptoms as defined by cases, and a negative SARS-CoV-2 RT-PCR/antigen test result. Finally, we excluded all RT-PCR/antigen tests that were obtained after receipt of a primary series of ChAdOx1 nCoV-19, BNT162b2 or Ad26.COV2.S vaccines.
We matched each case with one control according to the age (± 10 years), sex, municipality of residence, variant period, and RT-PCR/antigen test sample collection date (± 10 days). The algorithm used for the continuous variables (age and test sample collection date) was nearest neighbour matching. After identification of each case, we randomly chose one control from the set of all eligible matching controls, allowing for the replacement of controls. We performed a sensitivity analysis on the matching approach by creating strata of unique combinations of the matching factors (age category in 10 years band, sex, municipality of residence, variant period and week of testing). The numbers of cases and controls per stratum are not pre-specified, and strata with no cases, or with no controls, were excluded. This leads to varying ratios of cases to controls. This was done to use all available information, reducing how often unmatched cases or controls needed to be discarded and no case or control appears in more than one stratum, thus dealing with the potential issue related to replacement. To improve the computational performance of the models while retaining the majority of cases, large strata were reduced in size by dividing into smaller strata. In strata with more controls than cases, each stratum allowed a case to be matched to up to ten controls, and vice versa. For strata with at least ten times as many controls as cases, excess controls were discarded, and vice versa. In this way, strata sizes varied from two to eleven20.
Statistical analysis
We estimated the vaccine effectiveness of booster doses of CoronaVac and BNT162b2 against symptomatic Covid-19 in the 0-7 days, 8-59 days and ≥60 days after the booster dose. We also estimated the vaccine effectiveness of a booster dose against Covid-19 hospitalization and/or death by restricting the analysis population to case-control pairs in which the case was hospitalized or died3,5,30,31. Symptomatic Covid-19 includes mild and severe cases. Severe Covid-19 was defined as hospital admission and death with severe acute respiratory infection due to SARS-CoV-2 (positive RT-PCR/Antigen test). For the analyses of symptomatic and severe Covid-19, we considered the date of respiratory sample collection as the date of the event. There are several choices of controls for severe outcomes, including community nonsyndromic controls, community syndromic controls, and hospitalized test-negative controls with or without symptoms30,32,33. Each has their advantages and disadvantages in how well they represent the source population in their uptake of Covid-19 vaccination. We choose a priori to use community and hospitalized syndromic controls as we agreed these are the controls that better represent the vaccination status in the Brazilian setting. Additionally, we chose syndromic controls to reduce the bias in testing behaviour25, as those tested in the absence of symptoms are more likely to be part of special groups of individuals (e.g., healthcare workers). The reference group was unvaccinated individuals. For the secondary analysis assessing waning effectiveness, we estimated the relative vaccine effectiveness (rVE)7,34, using booster eligible (≥180 days after the second dose) CoronaVac recipients as the reference group, and stratified the time since booster administration by 8–59 days, 60–89 days, 90–119 days and ≥120 days. We used RT-PCR/Antigen test respiratory samples to define cases and controls in any effectiveness analyses. Cases and controls that were not linked to the vaccination database were ascertained as unvaccinated.
We used conditional logistic regression to estimate the adjusted odds ratio (aOR) of vaccination comparing cases and controls, and (1−aOR)*100 provided an estimate of vaccine effectiveness under the assumptions of a test negative design30. Because age is a strong determinant of Covid-19 outcomes, we adjusted for age (as a continuous variable, modeled with a restricted cubic spline) after matching to control for potential residual confounding within age bands. We also adjusted for chronic comorbidities (including cardiovascular, renal, diabetes, chronic respiratory disorder, obesity, or immunosuppression, categorized as 0, 1, and ≥2 comorbidities), self-reported race, and any previous symptomatic event that were reported to the surveillance systems (categorized as 0, and ≥1). We adjusted for self-reported race because it is a main surrogate of socioeconomic status and associated with risk of infection and outcomes in Brazil3. Prior SARS-CoV-2 exposure is defined as notified acute respiratory infection or positive SARS-CoV-2 test result prior to the sampled RT-PCR/Antigen test. This variable is our best surrogate of previously confirmed or suspected infection of SARS-CoV-2. We considered the vaccine effectiveness estimates for the 0-13 days after the first dose as a “bias indicator”, because it is expected that vaccines have no or limited effectiveness for this period35.
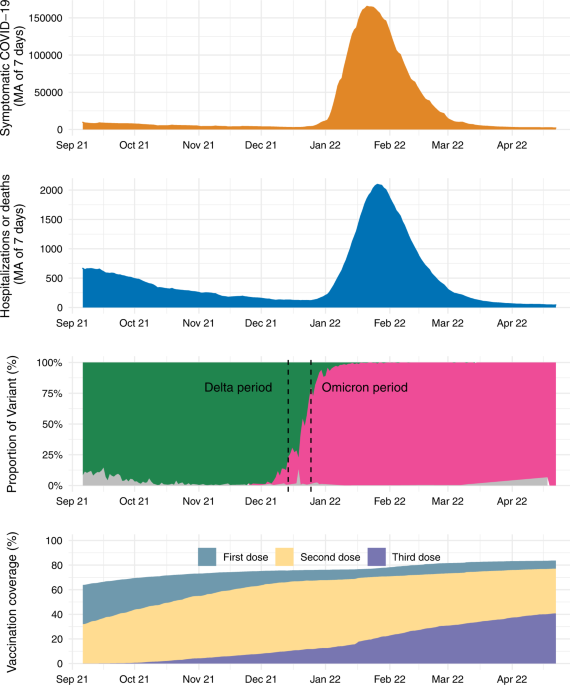
We conducted an analysis of vaccine effectiveness within age subgroups (<60, 60-74 and vs ≥75 years old) by adding an interaction term with the vaccination category. Because the analysis period incorporated a Delta (B.1.617.2) (September 6, 2021 to December 14, 2021) and Omicron (December 25, 2021 to April 22, 2022) period, we conducted separate analyses in each time period. We defined the end of the Delta period as when national Omicron VoC prevalence amongst sequenced genomes reached 25% and the beginning of the Omicron period as when the prevalence reached 75% in the GISAID database36. We conducted the same analyses using only RT-PCR tests as a sensitivity analysis, to address potential misclassification. Finally, we conducted two posthoc sensitivity analyses, evaluating vaccine effectiveness in the main analysis population defining severe Covid-19 as use of respiratory support, intensive care admission, and death with severe acute respiratory infection due to SARS-CoV-2 (positive RT-PCR/Antigen test); and evaluating relative vaccine effectiveness in the main analysis population further adjusting by month of second dose as a factor in the model.
All analyses were done in R (v.4.1.2)37
Reporting summary
Further information on research design is available in the Nature Research Reporting Summary linked to this article.


