Defective activation and regulation of type I interferon immunity is associated with increasing COVID-19 severity

Decreased blood IFNα protein, ISGs, and activity in severe and critical COVID-19 patients
We previously reported lower plasma IFNα2 levels in COVID-19 patients with severe and critical disease, when assessed 8–12 days post-symptom onset2. A multinomial logistic regression model integrating age and sex (Supplemental Data 1) showed significantly higher levels of plasma IFNα2 in moderate (P = 0.005) and severe (P = 0.03) disease compared to uninfected controls, but no increase in the critical group (P = 0.33) (Fig. 1a). Using the moderate group as the reference, significantly (P = 0.02) lower levels were present in the critical group (Fig. 1a). To test if this was also observed for all 13 IFNα subtypes, we applied the multi-IFNα subtypes digital ELISA (measured as the equivalent of IFNα17) and observed a similar pattern, with significantly higher levels of all IFNα subtypes in moderate (P = 0.002) and severe (P = 0.005), and also a significant increase in critical patients (P = 0.01), as compared to non-infected healthy controls. Using the moderate group as the reference, significantly (P = 0.005) lower levels were present in the critical group (Fig. 1b). Due to conflicting reports on IFNα levels in other studies using non-digital assays, we assessed IFNα2 in the same samples using a commercial Luminex assay. Strikingly, results from this assay showed no differences between controls and moderate, severe, and critical COVID-19 patients (Fig. 1c). To test which protein assay best reflected in vivo activity, we correlated measurements from each assay with an ISG score (6 gene score, previously validated and described in the “Methods” section2) (Fig. 1d–f), and with IFN activity measured by a functional cytopathic assay previously described2 (Fig. 1g–i). IFNα2 and multi IFNα subtype proteins measured by digital ELISA showed good positive correlations with both ISG score (Rs = 0.69, Rs = 0.82) (Fig. 1d, e) and functional activity (Rs = 0.51, Rs = 0.57) (Fig. 1g, h), in contrast with the Luminex values which did not correlate with either ISG score (Rs = 0.07) (Fig. 1f) or functional activity (Rs = 0.12) (Fig. 1i). The two digital ELISA measures strongly correlated with each other (Fig. S1a), but neither correlated with the Luminex values (Fig. S1b, c). These collective results highlight the importance of using sensitive and qualified assays for studying IFN-I proteins in human samples. Given the challenges of comparing different patient severities in terms of time post-infection, we also examined whether time–post-symptom onset was associated with IFNα protein levels, but no significant associations were observed for each patient severity with the three separate assays (Fig. S1d–f). In contrast to IFNα, we detected no IFNβ in these plasma samples using a Simoa assay with a limit of detection of 0.6 pg/ml (Fig. S1g).
a IFNα2 (left) and b multi-IFNα subtypes (=equivalent IFNα17) were measured by Simoa digital ELISA or c Luminex in healthy controls (n = 14 donors) and in patients with moderate (n = 15), severe (n = 13) and critical (n = 27) disease from the first Hopital Cochin cohort. Interferon-stimulated gene (ISG) score (6 gene score) correlated with IFNα levels measured by d Simoa IFNα2, e Simoa multi IFNα subtypes or f Luminex; n = 64. IFN activity (IU/mL) correlated with IFNα levels measured by g Simoa IFNα2, h Simoa multi IFNα subtypes, or i Luminex IFNα2; n = 35. j IFNα2, k multi-IFNα subtypes (=equivalent IFNα17) were measured by Simoa digital Elisa or l IFNα2 by Luminex in patients with moderate (n = 35), severe (n = 32) and critical (n = 21) disease from the second Hopital Cochin cohort. Lines indicate median values. P values were determined by multimodal regression models incorporating age and sex. Rs represents the Spearman coefficient. Healthy control = black, moderate COVID-19 patients = blue, severe COVID-19 patients = purple and critical COVID-19 patients = red. N = number of individual patients included. Source data are provided as a Source Data file.
To validate our results in an independent cohort, and also assess potential differences with non-alpha SARS-CoV-2 viral variants, we applied the three IFNα assays to another cohort of COVID-19 patients (Supplemental Data 2) recruited during a different wave of infection when the delta variant was prominent (December 2020–April 2021). The overall pattern of results was similar with the lowest protein levels observed in critical patients using the digital ELISAs (Fig. 1j, k), and no differences between patient groups using Luminex (Fig. 1l). Multimodal logistic regression models integrating age and sex, using the moderate group as a reference, showed significantly lower IFNα2 (P = 0.04) and multi-IFNα subtype (P = 0.01) proteins in the critical patient group. Interestingly much greater heterogeneity (5 logs of variability compared to 3) was observed in the IFNα plasma levels in this replication cohort compared to the first cohort (Fig. 1a–c) likely reflecting a more diverse and older patient cohort (median ages; 55 years cohort 1 and 66 years cohort 2, P < 0.001) (Supplemental Data 2). As in the first cohort, the two digital ELISA measures strongly correlated with each other (Fig. S1h), but neither correlated with the Luminex values (Fig. S1i, j). These results highlight the challenges in comparing cytokine responses across clinical cohorts with different underlying characteristics and the importance of considering such variables in the interpretation of immune data during active infection.
Given the high variability observed in IFN-I plasma levels, as well as the challenges of obtaining samples from early in infection, we tested whether we could observe significant differences in IFN-I protein levels between COVID-19 patients that were either non-hospitalized or hospitalized based on their requirement for oxygen supplementation. For this analysis, patients were recruited at St James’s Hospital (SJH) in Dublin, Ireland as described in the “Methods” section (Supplemental Data 3). Multimodal regression models incorporating age and sex, and using healthy controls as the baseline showed a significant (P = 0.008) increase in IFNα2 (Fig. 2a) levels in non-hospitalized, but not hospitalized patients (P = 0.24). In contrast, results with the multi-IFNα subtype assay showed a significant increase in all subtypes in both non-hospitalized (P = 0.04) and hospitalized patients (P = 0.03) (Fig. 2b). Confirming these potential IFNα subtype differences a direct comparison between the two COVID-19 patient groups showed a significant difference (P = 0.004) in IFNα2 levels only (Fig. 2a, b). In agreement with the previous results, IFNβ levels were undetectable in the majority of patients, with no differences between the groups and controls (Fig. S2a). An ISG score (Z score of ISGs measured by nanostring, described in the “Methods” section) in paired whole blood samples correlated positively and significantly with both Simoa IFNα measures (IFNα2: Rs = 0.36, P = 0.005 Fig. S2b, and multi-IFNα subtype: Rs = 0.42, P = 0.002, Fig. S2c); but not IFNβ (Fig. S2d).
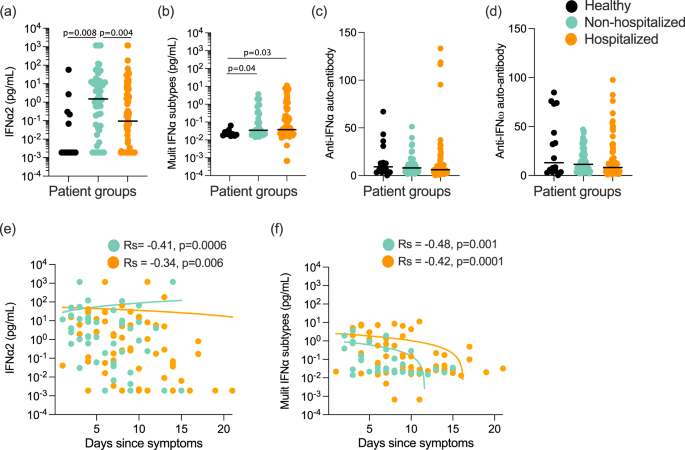
a IFNα2 and b multi-IFNα subtypes (=equivalent IFNα17) measured by digital ELISA Simoa in healthy controls (n = 14 donors), non-hospitalized (n = 51), or hospitalized (n = 85) COVID-19 patients of the St. James Hospital cohort. c Anti-IFNα and d anti-IFNω auto-antibodies in plasma of these healthy controls and COVID-19 patients. e IFNα2 and f multi-IFNα subtype cytokine levels as a function of the number of days post symptoms, with regression lines per COVID-19 patient groups shown. P values were determined by multimodal regression models incorporating age and sex. Lines indicate the median values. Healthy control = black, non-hospitalized COVID-19 patients = green, and hospitalized COVID-19 patients = orange. Rs indicates Spearman correlation, n = number of individual patients included. Source data are provided as a Source Data file.
Given the observed differences in IFNα2, but not all IFNα subtypes, at the plasma protein level, we further explored potential differences in IFNα subtype expression using Nanostring gene expression data on whole blood. This showed low transcriptional levels of all measured IFNA subtypes as expected (Fig. S2e). Despite these low baseline levels, among the 7 IFNA subtypes examined we did observe some subtype differences, with notably higher levels of IFNA6 and IFNA5 in both COVID-19 patient groups and IFNA1/13 only in the hospitalized group (Fig. S2e). IFNA2 was notably no different between all three groups (Fig. S2e).
Given the previously reported importance of autoantibodies as a risk factor for severe COVID-194, and their potential to interfere with IFNα protein measurements25, we quantified anti-IFNα (Fig. 2c) and anti-IFNω (Fig. 2d) autoantibodies by Gyros assay. Among the 126 patients tested, 4 were identified as anti-IFNα autoantibody-positive (>95 was considered positive, based on the distribution in previously published healthy controls5) and all were male patients (aged 31, 53, 81, and 85 years old) in the hospitalized group with mixed severities at time of sampling (2 moderate, 1 severe, 1 critical) (Fig. 2c). Interestingly, of these 4 patients, multi IFNα subtype results were extremely low (Fig. S2g), although 2 had elevated levels with the IFNα2 assay (Fig. S2f). We previously described how recognition of IFNα2 in this specific assay is not always blocked by autoantibodies from all autoantibody-positive individuals25, likely due to recognition of a non-functional epitope in contrast with the multi IFNα subtypes assay. However, the majority of patients were negative for anti-IFN autoantibodies suggesting that this was not the driver of severe disease in these patients.
We next assessed whether IFNα levels changed with time post-symptoms in either patient group in this cohort. IFNα2 (Fig. 2e) and multi IFNα subtype (Fig. 2f) levels mostly declined with time post-symptoms in both patient groups (non-hospitalized; Rs = −0.41 and −0.48, and hospitalized; Rs = −0.34 and −0.42) with no significant differences in the decline (P = 0.45, P = 0.68 for IFNα2 and multi-IFNα subtypes respectively) between the two patient groups (Fig. 2e, f). IFNβ levels, although lower to begin with, also followed the same decline with time post-symptoms with no significant difference (P = 0.08) between the two patient groups (Fig. S2h).
Induction of type I interferon is compromised in hospitalized patients
Our results thus far demonstrating lower IFNα plasma levels in severe disease, yet similar kinetics across COVID-19 disease states, suggests that induction of IFN-I in the absence of autoantibodies is critical to understand defective anti-viral immunity in severe COVID-19. To investigate the functional IFN capacity of COVID-19 patients, whole blood from a sub-cohort of patients (Supplemental Data 4) was stimulated with immune agonists relevant for anti-viral immune pathway activation, namely Poly:IC (a synthetic analog of double-stranded RNA and reported TLR3/MDA5 agonist), R848 (a small molecular weight imidazoquinoline compound and TLR7/8 agonist), as well as LPS (Lipopolysaccharide (LPS) synthesized by E. coli and a TLR4 agonist), and a Null condition as positive and negative controls, respectively. At 22 hrs, IFNα2 was weakly induced by Poly:IC stimulation, but strongly induced by R848 (Fig. 3a). Measurement of all IFNα subtypes revealed a broader response with the highest levels in non-hospitalized patients (Fig. 3b). Multinomial logistic regression models integrating age and sex, and using the healthy group as the reference, showed significantly higher (P = 0.01) multi-IFNα subtype levels in non-hospitalized moderate patients after Poly:IC (P = 0.01) and LPS (P = 0.002) stimulation, but not in more severe patients (Fig. 3b). More striking was the IFNβ response which was significantly reduced (P < 0.001) after Poly:IC stimulation in both COVID-19 groups compared to controls, but also significantly reduced after R848 (P = 0.005) and LPS (P = 0.04) stimulation in only the hospitalized groups (Fig. 3c).
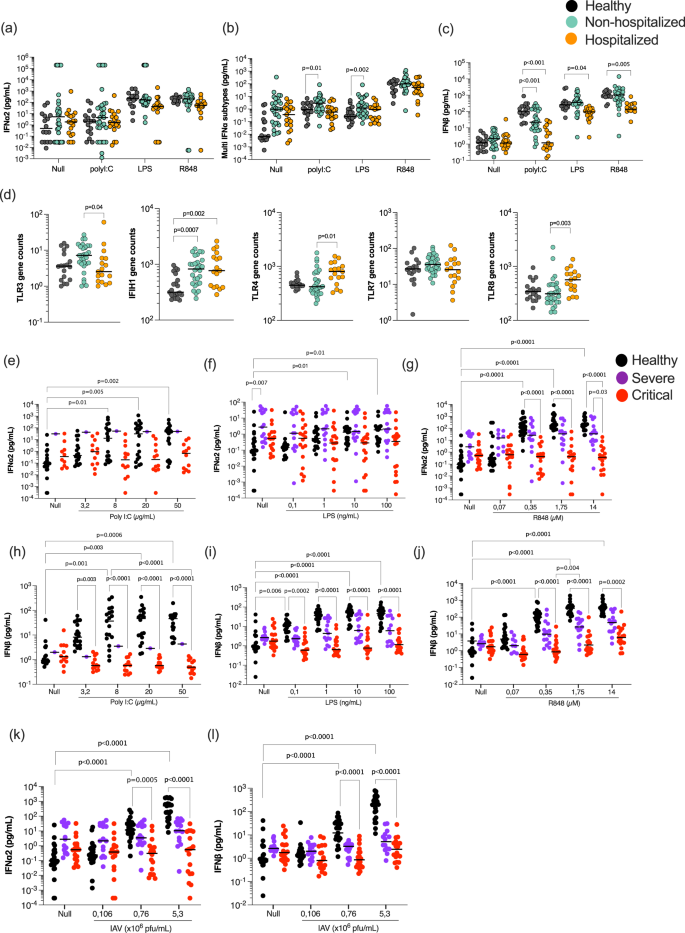
a IFNα2, b multi-IFNα subtypes (equivalent IFNα17), and c IFNβ were measured by digital ELISA in healthy controls (n = 20), non-hospitalized (n = 30) and hospitalized (n = 18) COVID-19 patients after 22 h of whole blood stimulation with Poly:IC, LPS and R848. d mRNA of TLR3/4/7/8 and IFIH1 whole blood gene expression in healthy controls, non-hospitalized, and hospitalized COVID-19 patients. IFNα2 (e–g, k) and INFβ (h–j, l) responses in healthy donors (n = 24), severe (n = 11), and critical (n = 20) COVID-19 patients after variable dose stimulation with Poly:IC (e, h), LPS (f, i), R848 (g, j) and influenza virus (k, l). Black lines represent the medians. P values were determined either by multimodal regression models incorporating age and sex or by Kruskal–Wallis test followed by Dunn’s post hoc test for multiple comparisons. Healthy controls = black, non-hospitalized COVID-19 patients = green and hospitalized COVID-19 patients = orange, severe = purple, and critical patients = red. N = number of individual patients included. Source data are provided as a Source Data file.
To assess whether differences in receptor expression could explain these cytokine differences, we examined the relevant TLR gene expression data from whole blood. Expression of TLR7 was similar in all groups, while expression of TLR3 was significantly (P = 0.04) lower, and expression of TLR4 (P = 0.01) and TLR8 (P = 0.003) was significantly higher, in hospitalized patients. Expression of IFIH1 was higher in both patient groups, although the effects were modest and the differences are unlikely to explain the differences in cytokine responses (Fig. 3d). To examine whether these immune differences were restricted to IFN-I responses, we measured an additional 42 cytokines in the whole blood stimulations by Luminex (Fig. S3, Supplemental Data 5). This revealed 8 additional cytokines with significant differences in hospitalized patients, mostly after TLR3 stimulation (Fig. S3). However, half of these differential cytokines (CXCL10, IL-12p70, CCL4, and IL-10), which were all lower in hospitalized patients after Poly:IC stimulation, are downstream of IFN-I responses. This further supports the finding of defective IFN-I responses in unfavorable COVID-19 states.
To confirm these observations in an independent cohort of COVID-19 patients with more severe disease, we sampled additional hospitalized patients from two Parisian clinical centers (Supplemental Data 5). Given previous studies indicating age and sex as strong risk factors, we also recruited severe and critical patients with similar ages (medians; 63 and 76 years old, respectively, P = 0.05) and sex distribution (40% and 26% female, Fisher test 0.7) (Supplementary Data 5). We also tested lower agonist concentrations, to assess more subtle induction of IFN-I responses and avoid potential over-stimulation, to which acutely infected patients may be more sensitive. In this independent cohort, we again observed a strongly reduced IFNα2 (Fig. 3e–g) and IFNβ (Fig. 3h–j) secreted response to Poly:IC, LPS and R848 stimulation in critical COVID-19 patients in comparison to healthy controls. Severe COVID-19 patients showed an intermediate response. We also included a live viral stimulus (influenza H1NI1 PR8 strain), to which the IFN-I (IFNα2 and IFNβ) response was also significantly reduced as the disease severity increased (Fig. 3k, l). Collectively these results show a broadly perturbed type I interferon response to diverse immune stimulation that increases with disease severity.
Compromised interferon responses at the cellular level with increasing COVID-19 severity
Previous studies have reported multiple cellular and intracellular perturbations in patients with moderate as well as severe COVID-19. To test whether changes in either cell numbers or interferon regulatory transcription factors (IRFs), could explain the severely reduced IFN responses to pattern recognition receptor (PRR) stimulation, we performed multi-parameter intra-cellular flow cytometry on the blood of hospitalized COVID-19 patients (Supplemental Data 5, Fig. S4a, Table S2). In line with previous findings, we observed a significant increase in circulating granulocytes and monocytes, in parallel to a significant decline in T cells and pDCs, in critically infected patients confirming that our cohort exhibited the typical immunological dysregulation associated with increasing severity of COVID-19 (Fig. 4a). To assess IFN-I signaling pathways we measured intracellular phosphorylated IRF3 and IRF7, and intracellular IFNα2 after R848 stimulation (Fig. S4b–d). Analysis of the percentage of positive cells and mean fluorescent intensity (MFI) showed that pIRF7 significantly increased in different monocyte subsets and pDCs of healthy donors after R848 stimulation (Fig. S4b). Changes in percentages and MFI of pIRF3 and intracellular IFNα2 were more modest but were also detectable in monocytes and pDCs after R848 stimulation (Fig. S4c, d).
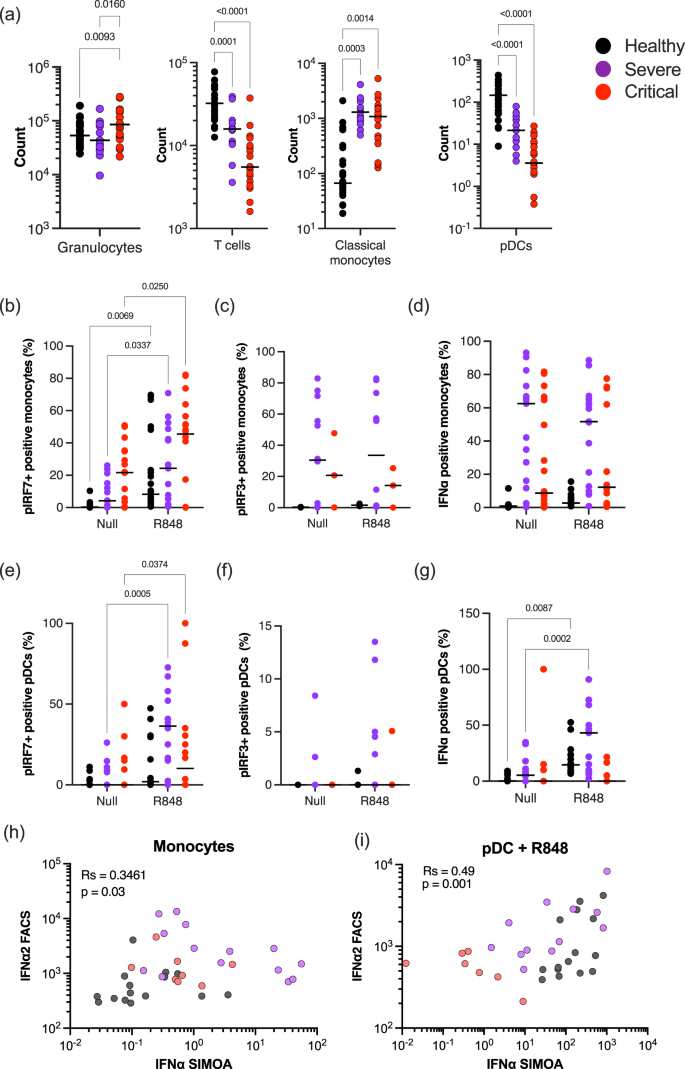
a Counts of granulocytes, T cells, classical monocytes, and pDCs in the blood of healthy controls (n = 29), severe (n = 11), and critical (n = 20) COVID-19 patients. Percentages of b, e phosphorylated IRF7, c, f phosphorylated IRF3, or d, g intracellular IFNα positive monocytes (b–d) and pDCs (e–g) in the blood of healthy controls, severe and critical COVID-19 patients in the absence of stimulation or after overnight stimulation with R848. Correlation of intracellular IFNα2 measured by flow cytometry with plasma IFNα2 levels measured by Simoa in h monocytes without stimulation or in i pDCs after R848 stimulation. P values were determined by Kruskal–Wallis test followed by Dunn’s post hoc test for multiple comparisons. N = number of individual patients included. Source data are provided as a Source Data file.
As our data showed that both pDC and monocyte cell subsets are major regulators of the type I IFN response in human blood in response to R848, we, therefore, focused on these cell types in COVID-19 patients. We observed a significant increase in pIRF7 in monocytes from severe and critical groups (Fig. 4b). However, this was not matched by an increase in intracellular IFNα2, perhaps due to the lack of induction of pIRF3 (Fig. 4c), or the elevated intracellular IFNα2 at the baseline in the absence of stimulation (Fig. 4d) in both severe and critical patients. In pDCs of COVID-19 patients, pIRF7 was also significantly increased after R848 stimulation (Fig. 4e), but in contrast to the monocytes this was matched by an increase in intracellular IFNα in severe, but not in critical patients (Fig. 4g). Additional correlation analysis between cytometry measured intracellular IFNα, and digital ELISA measured plasma IFNα, showed in the absence of stimulation, an association between monocytes and plasma IFNα levels (Fig. 4h). Following R848 stimulation, both pDCs and monocytes showed an association with secreted IFNα (Fig. 4i), although the percentage of IFNα+ cells was lower in critical patients compared to severe and healthy controls (Fig. 4d and g). Collectively these results indicate a perturbation of IFN signaling networks in the elevated numbers of circulating monocytes in all hospitalized COVID-19 patients. pDCs demonstrate a quantitative decrease in disease states but retain functional responsiveness in severe disease. This pDC functional response is lost in the critical disease.
Induced gene expression changes identify consistently perturbed myeloid-associated pathways
To further explore potential reasons behind the perturbed IFN-I responses in hospitalized patients, we examined gene expression differences after immune stimulation between hospitalized and non-hospitalized patients in the St. James cohort (Supplemental Data 4). To do this, we applied UMAP (Uniform Manifold Approximation and Projection for Dimension Reduction) to 800 immunology and host response-related genes measured by Nanostring in each condition (Null, PolyI:C, LPS, and R848) (Fig. 5a). This revealed clustering of the hospitalized patients and healthy controls, with the non-hospitalized patients spread between the two groups in all conditions including the unstimulated control. This suggests that induced immune responses are already perturbed at baseline in hospitalized COVID-19 patients. This highlights their already dysregulated state and is in line with the altered circulating IFN-I levels we observed. PolyI:C revealed the most distinct clusters, with hospitalized patients separating from controls along dimensions 1 and 2 (Fig. 5a).
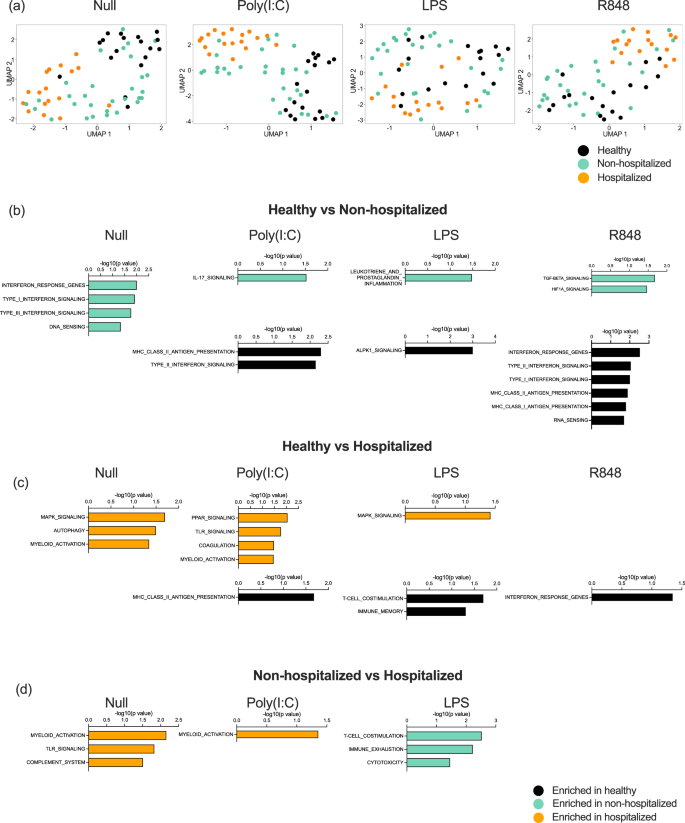
a UMAP plots of Nanostring gene expression in the Null control, and after whole blood stimulation with Poly:IC, LPS, and R848. Gene expression pathways enriched in healthy donors (black, n = 16), moderate non-hospitalized COVID-19 patients (green, n = 30), or hospitalized COVID-19 (orange, n = 18) patients after comparisons between b healthy and moderate, c healthy and hospitalized, d moderate and hospitalized, after whole blood stimulation with Poly:IC, LPS, and R848. N = number of individual patients included. Source data are provided as a Source Data file.
To examine differences at a biological pathway level, we applied gene set enrichment analysis (GSEA) to each stimulation condition specifically comparing healthy controls versus non-hospitalized (Fig. 5b), control versus hospitalized (Fig. 5c), and non-hospitalized versus hospitalized (Fig. 5d). The most significant pathway differences were observed in the healthy versus moderate non-hospitalized comparison. As expected from our previous findings and in line with circulating IFN-I measurements, the null state of moderate patients showed upregulation of type I and II IFN pathways, and these pathways were preferentially upregulated after R848 stimulation in controls (Fig. 5b, in black). Non-hospitalized COVID-19 patients also showed upregulated IL-17 responses, prostaglandin, and TGFB and HIF signaling to Poly:IC, LPS, and R848 stimulation (Fig. 5b, in green). Gene pathway alterations in hospitalized COVID-19 patients revealed consistently perturbed myeloid activation in unstimulated conditions and after Poly:IC stimulation, when compared with controls (Fig. 5c) and non-hospitalized patients (Fig. 5d). Additional pathways upregulated in hospitalized patients included coagulation, complement system, and TLR and MAPK signaling (Fig. 5c and d, in orange).
IFN-I stimulation drives non-canonical inflammatory signaling in hospitalized patients only
Finally, after identifying perturbations in baseline and induced IFN responses, we wanted to assess the direct signaling response to IFN-I in COVID-19 patients. For this, we performed the same standardized whole blood ex vivo stimulation with recombinant IFNα2 and measured gene expression by Nanostring as described in the methods. Application of an ISG Z score showed that non-hospitalized and hospitalized patients were unable to induce a classical ISG response following direct IFNα stimulation, as was also the case with Poly:IC and R848 stimulations (Fig. 6a). This was likely explained by the already elevated ISG score in the Null condition of these patients. To apply a less biased analysis, we defined all genes that were significantly induced by IFNα stimulation across the entire cohort (q value < 0.05, Log 1.3-fold change compared to Null condition). Application of these 200 genes (Table S3) to a heat map clustered by gene response and grouped by clinical category revealed interesting differences (Fig. 6b). 50% of the genes were only induced in controls, and pathway analysis showed that these genes were classically involved in IFN-I and anti-viral responses (Fig. 6c), as exemplified by MX1 (Fig. 6d). An additional group of genes was upregulated in both controls and non-hospitalized patients, that included TLR3, TLR7, CXCL10, CXCL11, and HLA molecules (Fig. 6b, e). Most interestingly, the third cluster of genes was differentially expressed in hospitalized patients only, with pathway analysis showing this to consist largely of an inflammatory response (Fig. 6f, g). Many of these genes were downregulated after IFNα stimulation in controls and moderate patients, but not in hospitalized patients, as exemplified by IL1R1 (Fig. 6g). One hospitalized patient was identified to be positive for anti-IFN autoantibody (indicated by an * on the heat map, Fig. 6b). Strikingly this individual patient clearly lacked a classical ISG response to ex vivo IFNα stimulation, but their response to this non-canonical inflammatory activity was not affected.
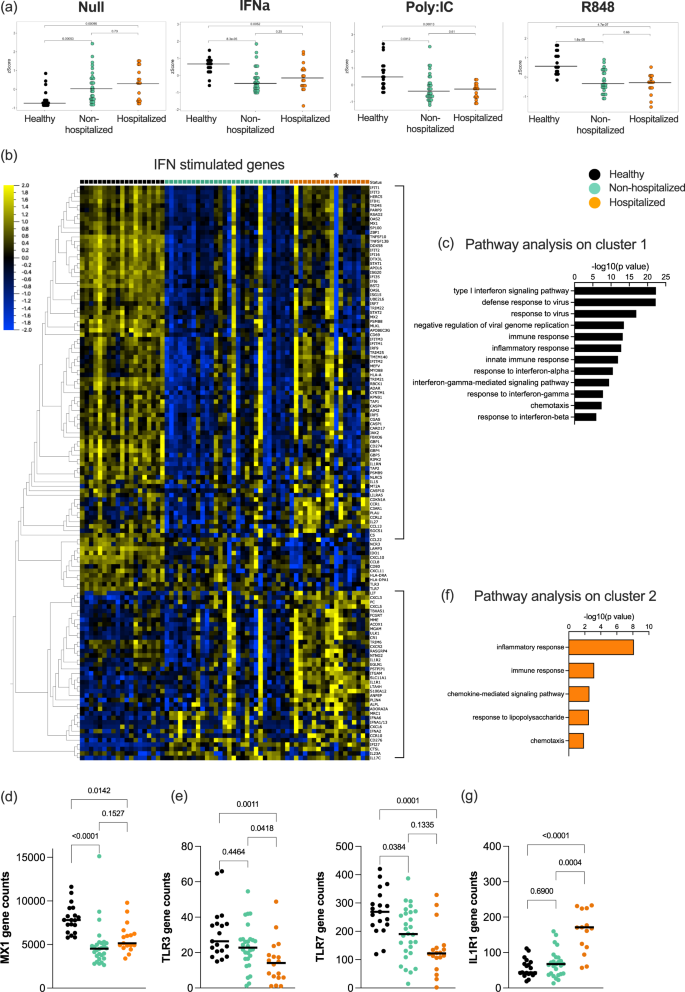
a Type I interferon gene signature (ISG) score calculated from Nanostring data in healthy controls (black, n = 19), moderate COVID-19 patients (green, n = 28), and hospitalized COVID-19 patients (orange, n = 18) in the Null control, and after stimulation with IFNα, Poly:IC, and R848. b Heat map of all IFN stimulated genes identified from Nanostring data in healthy controls (black), moderate COVID-19 patients (green), and hospitalized COVID-19 patients (orange). Pathways identified to be enriched after IFNα stimulation in c healthy donors and f hospitalized COVID-19 patients. Nanostring gene expression of d MX1, e TLR3 and TLR7, and g IL1R1 in whole blood of healthy controls (black), moderate COVID-19 patients (green), and hospitalized COVID-19 patients (orange). Black lines represent the medians. P values were determined with the Kruskal–Wallis test followed by Dunn’s post hoc test for multiple comparisons. N = number of individual patients included. Source data are provided as a Source Data file.

